NBA dashboard makes it simpler than ever to find prop spots
Have you caught our latest update to the NBA dashboard? The home page for trends is always a place we recommend starting for your player prop research on the desktop version of props.cash.
There, you can see all of the following for every player and every prop:
Line
Projection
Projection difference
Streak
Position
2023 hit-rate
L20 hit-rate
L10 hit-rate
L5 hit-rate
Vs. Opponent hit-rate
Last two seasons hit-rate
All are also color-coded, green = positive trend, red = negative trend.
Well, now, there’s another added layer that is organized right there for your prop research: Defensive rank vs. position.

Haven’t tried props.cash yet? Use code “NEWSLETTER” for 25% off your first month! Sign up here.
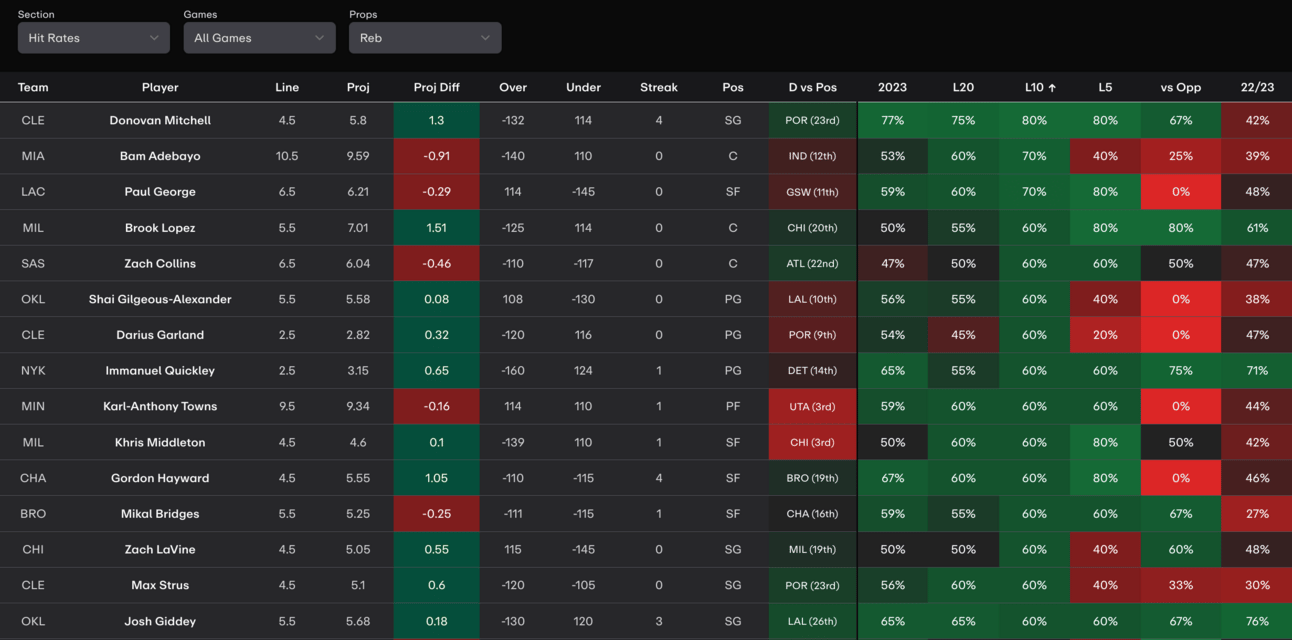
The D vs. Pos column is right there, after position and before the 2023 hit-rate. It represents where each team ranks in statistics allowed for that prop to that position, i.e. Chicago ranks 20th in points allowed/game to PFs. 30th = most, 1st = fewest.

The above is what our home page looks like if you want to look at the day’s rebound props. Right at the top, if sorted by L10 hit-rate, is Donovan Mitchell’s rebounds line at 4.5. Immediately you can now see that Portland ranks 23rd in rebounds allowed/game to SGs. That brings about a clean-sweep of green for Mitchell here on his boards tonight.
He’s over in 77% of games on the year, two of his last three against the Trail Blazers, and he’s projected to get 5.8. By all means, use this to simply click into Donovan Mitchell and explore the trend some more.

Mitchell is fresh off an 11-rebound performance and is over in four straight, averaging 5.4 rebounds/game on the season. He faced this Portland team just 15 days ago, coming away with six boards.
We highly recommend you start on our home page and see what you can find, we were just excited to announce the new feature here, in case you missed the latest update!
Using Power Play Metrics to find NHL player prop angles
On the NHL dashboard, there is plenty of data and supporting metrics built around potential power play opportunities and player roles on the PP.
Considering this angle for your NHL player props can be an important addition to your daily round of checks. Should a player be skating on his team’s top power play against a team that tends to both hand out multiple power plays/game and struggle to stop scoring with their penalty kill, you might consider that player a better bet for a goal or a point, or simply load up his power play point prop.
PPP (Power Play Point) is its own market, and typically has odds around +150 to +250. It can be a fun one to focus on, but a point recorded on the power play still just counts as a point, so it can really just be about knowing that element may come into play for a given team/player/game.
Let’s try and explain what we mean.

Take this Minnesota vs. Nashville game as an example. A quick click-through to some Nashville players will bring up all of the Wild’s defensive metrics. Clear as day you can see an ideal intersection here of Minnesota averaging the ninth-most penalty minutes per game and allowing the most power play goals/game.
That’s likely a big reason why Minnesota is averaging the second-most total goals allowed/game, and it can be reason enough to dig into some of the Predators top power play producers.

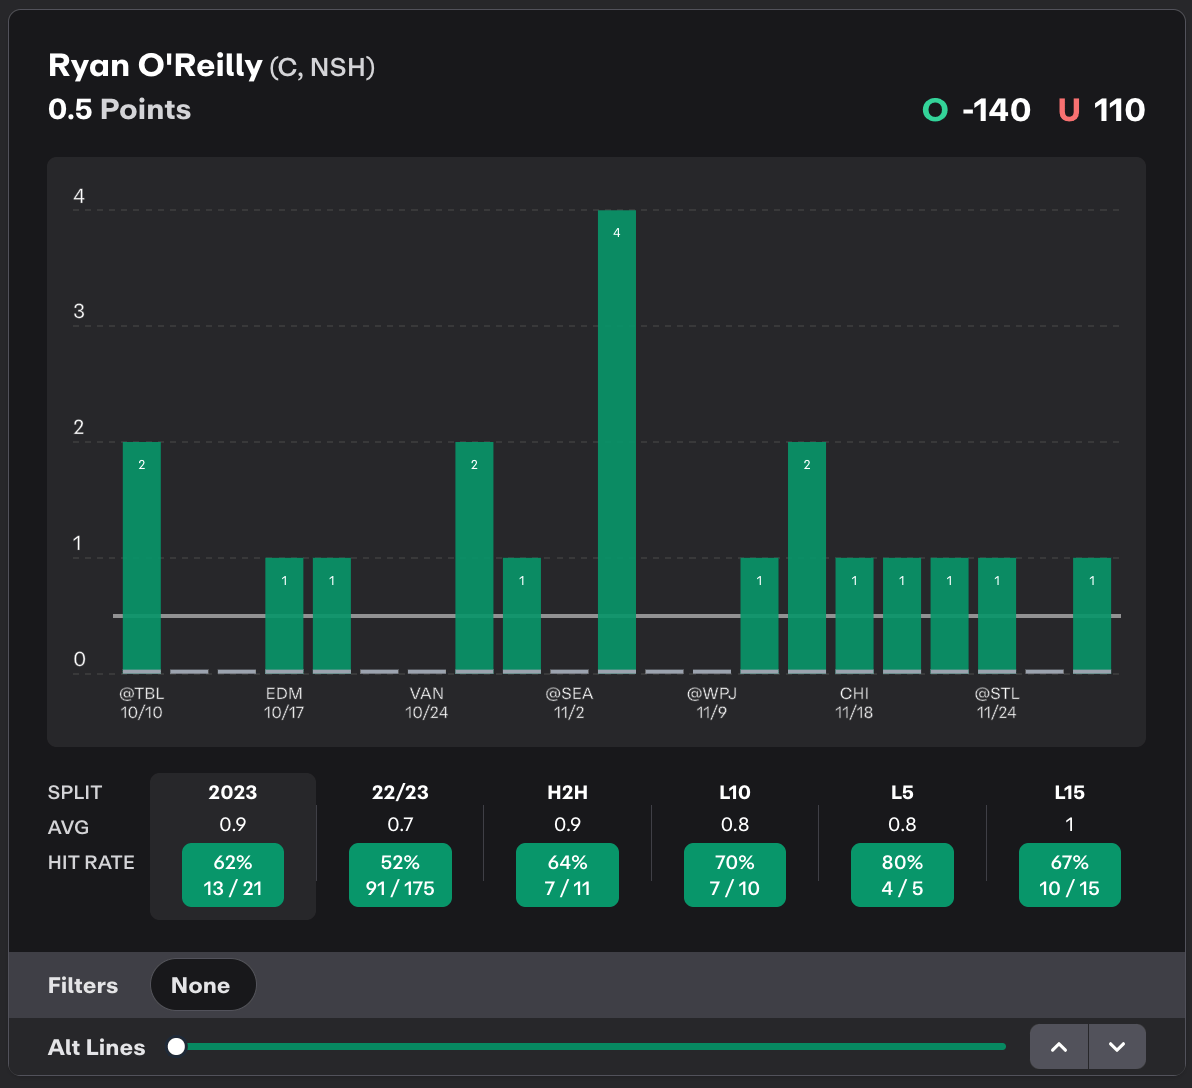
Ryan O’Reilly has a PPP at the highest rate for Nashville this season, recording one in eight of 21 games.

As you can see, his PP production is a massive reason why he has recorded a point in 13 of 21 games this year, eight of those 13 games was because of the power play.
On the web version of props.cash, there are numerous supporting metrics for a player that you can use as filters to track their impact on a certain prop hitting.
When O’Reilly gets 2+ PP minutes, he has a point in seven straight games and eight of his last 10.

Finding 2+ PP minutes also seems to be a common occurrence when O’Reilly has seen Minnesota.

ROR has a PPP in four of his last six games against the Wild.
Whether you take this a reason to load up O’Reilly’s PPP at +150 or just feel even more confident in his point at -140, the above should show that just a couple of minutes looking at Power Play metrics can help circle an intriguing trend for your night.
Get in there today and start factoring in power play numbers into your research, you might be surprised at what you can find.
Haven’t tried props.cash yet? Use code “NEWSLETTER” for 25% off your first month! Sign up here.
TNF Trends this Week

Dak Prescott Pass Yards
Dak Prescott has hit his “Pass Yards” prop in four of his last five – When looking at this L5, you’d see Prescott is averaging 320.4 PassYards. He now gets SEA who are allowing the 8th most PassYards/G – How many PassYards can Prescott record on TNF?

Zach Charbonnet Receptions
Zach Charbonnet has reeled in four or more “Receptions” in three straight games – While on this streak, Charbonnet is seeing 3.6 Targets/G while averaging 3.4 Rec/G. Will Charbonnet be able to extend his streak vs DAL’s tough pass defense?
NBA Trends for Tonight

Donovan Mitchell Assists
Donovan Mitchell has recorded five or more “Assists” in seven of his last 10 – Across this span, Mitchell is logging 5.4 Assists/G. The Trailblazers are allowing the 13th most Assists/g this season. Mitchell has failed to hit this number in two of his last three games vs POR, can he go over tonight?

Immanuel Quickly 3PT Made
Immanuel Quickley has eclipsed his “3PT Made” prop in seven of his last 10 – When looking at his L10, you’d see that Quickley is draining 2.6 3PTM/G while taking 6.4 3PTA/G. He now gets the Pistons who allow the 4th fewest 3PTM/G but have the 10th highest Opponent 3PT%